How I investigated a Kafka consumer that kept leaving its group
My investigation of recurring disconnects and rebalances: the logs, monitoring, staging results, and decision to separate consumer groups and improve job processing.
· 15 min read
I was investigating a service that appeared to keep disconnecting from Kafka. Its logs showed failed rebalances, consumers leaving and rejoining their group, and failed offset commits. Work was being received more than once, and messages were waiting longer to be processed.
My first question was whether Kafka connectivity was the problem. Following the events in order led me to a more useful question: was the service taking too long to return to poll()? That became the starting point for checking the listener, building a monitoring baseline, and testing a change in staging.
I followed the disconnect back through the logs
The rebalance error that caught my attention was:
rebalance failed due to 'null' (DisconnectException)
The null did not identify a broken configuration value. The request had failed with a disconnect and no useful exception message. I needed the surrounding events to understand what had happened.
In the same investigation, I found a much more specific sequence:
consumer poll timeout has expired
sending LeaveGroup request ... due to consumer poll timeout has expired
Resetting generation and member id ...
The polling warning said that the time between calls to poll() had exceeded max.poll.interval.ms. The departure log gave me direct evidence of why that consumer was leaving. I kept the disconnect investigation alongside it, rather than treating every disconnect as another poll timeout.
This also corrected my initial understanding of heartbeats. The warning was emitted by the heartbeat thread, but it described a polling problem. Background heartbeats can continue while the listener is busy; they do not prove that the application is returning to poll in time. Kafka's polling and heartbeat design explains the distinction.
To reconstruct an incident, I keep this CloudWatch Logs Insights query close at hand:
fields @timestamp, @message, @logStream
| filter @message like /poll timeout has expired|sending LeaveGroup request|DisconnectException|coordinator|rebalance failed|Successfully joined group|CommitFailedException/
| sort @timestamp asc
| limit 500
I select the relevant application log groups and a narrow time window, then follow one consumer and group through the sequence. If several consumers are interleaved, I add a filter for the identifier I am investigating. The row limit is useful for reading an episode; it is not how I count all events over a day.
I checked what the listener was actually doing
I initially pictured one consumer with several processing threads. In this Spring Kafka service, listener concurrency created separate child containers and consumers. Each consumer processed its returned records synchronously. Its next poll could be delayed by job processing, downstream calls, and acknowledgements. Spring Kafka listener containers documents that concurrency model.
I checked the effective configuration used by the running service, not just the defaults in an infrastructure module. Environment overrides mattered. I also checked subscriptions, group IDs, partition assignment, application instance count, and acknowledgement behavior.
Several workloads subscribed to different topics but belonged to the same consumer group. The group used classic coordination and eager assignment. A slow member could therefore trigger an interruption that reached otherwise faster listeners in that group.
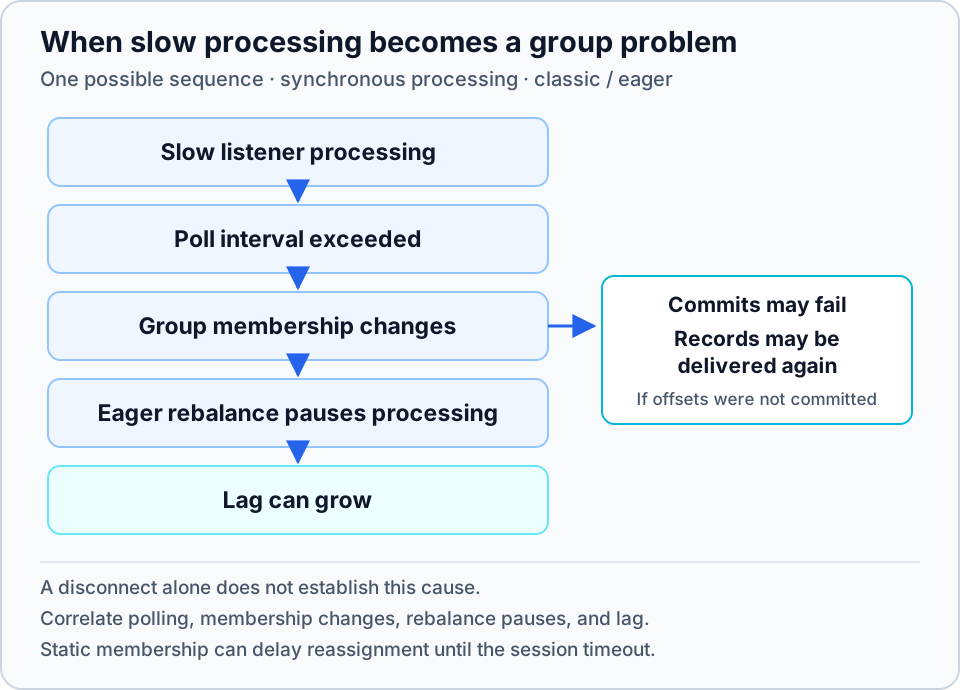
That gave me a working explanation for the membership loss: processing was delaying the next poll. It did not yet tell me whether one exceptionally slow record or the combined processing of a returned batch was responsible.
I built a baseline before changing anything
I wanted to reduce instability without quietly reducing useful throughput or moving the problem somewhere else. I used CloudWatch logs and MSK metrics to connect service behavior with the backlog, and checked application and database resources alongside them.
These are the questions I would put on the dashboard again:
| Question | What I monitor | How I interpret it |
|---|---|---|
| Is the listener missing its polling budget? | Poll-timeout logs; time-between-poll-max and last-poll-seconds-ago when application telemetry exposes them; processing-duration p50/p95/p99/max | Long processing is a clue. The complete interval between polls is the measurement to compare with the budget. |
| How disruptive are rebalances? | Group generation changes; rebalance-total, rebalance-latency-avg/max, failed-rebalance-total; elapsed partition revoke-to-reassign time | I compare frequency and duration, broken down by consumer and workload. |
| Are completed jobs losing their commits? | Failed to commit offset, CommitFailedException, and commit latency | A job may complete while its acknowledgement fails after membership is lost. |
| Is useful work still progressing? | Successful jobs per interval, failures, producer/topic input volume, job mix, and repeated receives | I compare completions with incoming work. Receive counts can include redelivery. |
| Where is the backlog growing? | MSK SumOffsetLag, MaxOffsetLag, and EstimatedMaxTimeLag by group/topic | Total backlog, a single bad partition, and estimated delay answer different questions. |
| Is the service constrained? | ECS CPU and memory trends, sustained peaks, task replacements/restarts, and GC pauses if available | I look for sustained changes, not only one high maximum. |
| Are downstream calls slowing the listener? | Database query/commit latency and errors; proxy borrow latency and borrowed connections | A Kafka timeout can begin with slow work outside Kafka. |
| Is the broker or connection unhealthy? | Broker CPU, fetch latency/queue time, network/coordinator events, offline and under-replicated partitions | I check this alongside the application timeline instead of assuming the brokers caused it. |
Kafka consumer metrics need to be exported by the application; they are not automatically MSK broker metrics. time-between-poll-max is measured in milliseconds, while last-poll-seconds-ago uses seconds. Kafka 4.3 monitoring lists the consumer metrics and their meanings. When applying these checks, I match consumer metrics to the application's Kafka library version and broker metrics to the MSK broker version.
For MSK, I look at SumOffsetLag as a backlog gauge over time, using its average and maximum rather than summing snapshots into an invented message total. MaxOffsetLag exposes the worst partition; EstimatedMaxTimeLag is an estimate, not measured end-to-end latency. A gap is not zero lag: MSK emits lag metrics only for groups in stable or empty states. MSK lag monitoring explains that limitation.
For database-backed processing, useful proxy signals include DatabaseConnectionsBorrowLatency and DatabaseConnectionsCurrentlyBorrowed. I correlate them with query duration and connection pressure. RDS Proxy monitoring defines those metrics.
I counted events instead of counting displayed rows
An early baseline was undercounted because a raw log search reached its result cap. I changed the approach to aggregate counts over complete windows. The investigation also exposed a missing exception path: searching only the application's failed-commit message could miss acknowledgement failures logged as CommitFailedException. That is why the reusable query below keeps both signals.
This query gives the main event counts in the same time bins:
fields @timestamp, @message
| filter @message like /consumer poll timeout has expired|sending LeaveGroup request|Failed to commit offset|CommitFailedException|DisconnectException/
| stats
    sum(strcontains(@message, "consumer poll timeout has expired")) as pollTimeouts,
    sum(strcontains(@message, "sending LeaveGroup request")) as leaveGroupEvents,
    sum(strcontains(@message, "Failed to commit offset")) as failedCommitMessages,
    sum(strcontains(@message, "CommitFailedException")) as commitExceptions,
    sum(strcontains(@message, "DisconnectException")) as disconnectEvents
  by bin(1h)
The patterns need to match the logger's actual text. These are log-event counts: two log lines for one failure can count twice, and a missing match can count zero. I check sample events before trusting a widget. CloudWatch aggregation and string functions provide the building blocks.
LeaveGroup events and completed rebalances are different measurements. Several departures can contribute to one group transition, and repeated “already rebalancing” messages can belong to the same episode. I use group generation changes as an additional signal and correlate them with partition callbacks instead of treating every rebalance-related log line as a new rebalance.
I made the comparison fair
I recorded the deployed configuration, task count, time zone, and observation windows. I looked for comparable traffic and job types before comparing the results. A quiet period can make a slow consumer look healthy.
Received-job logs helped locate busy intervals, but repeated receives were not necessarily new producer traffic. When available, producer/topic input metrics or unique first-seen job IDs provide a better comparison. The investigation also exposed a duration-view bias: excluding redeliveries could distort the baseline. In future comparisons, I would keep the inclusion rule consistent across both windows.
I tested smaller batches and a longer polling allowance
The staging change reduced max.poll.records and increased max.poll.interval.ms. The smaller returned batch reduced the amount of synchronous work before the next poll, and the longer interval gave that work more time.
max.poll.records limits the records returned by a poll, not the underlying fetch size. Dividing the interval by that limit gives a planning average for a full batch, not a deadline for each message. One sufficiently slow job can still exceed the whole interval. Kafka consumer configuration defines the settings.
The before-and-after staging comparison showed a useful improvement, but also a tradeoff:
| What I checked | What the staging comparison showed |
|---|---|
| Poll timeouts and group rebalances | Became less frequent |
| Failed commits and repeated receives | Decreased |
| Lag for the slower workload | Improved |
| Successful processing throughput | No observed reduction under comparable traffic |
| Remaining rebalance pauses | Became longer |
| Backlog for another workload | Increased, with incoming traffic also higher |
| Service CPU | No meaningful change |
Both polling settings changed together, so I could not separate their individual contributions. Some individual jobs still took longer than the new allowance. The change was a mitigation, not the end of the investigation.
Fewer rebalances did not mean shorter interruptions
This was the result I most wanted to understand. The group rebalanced less frequently, yet other workloads could wait longer during each remaining rebalance.
In classic coordination, increasing the polling allowance can also increase how long the group may wait for a busy member to participate. With eager assignment, other listeners can be paused while the group reorganizes. A member doing long synchronous work may not be ready to rejoin until it returns to poll. Kafka's classic rebalance design explains that tradeoff.
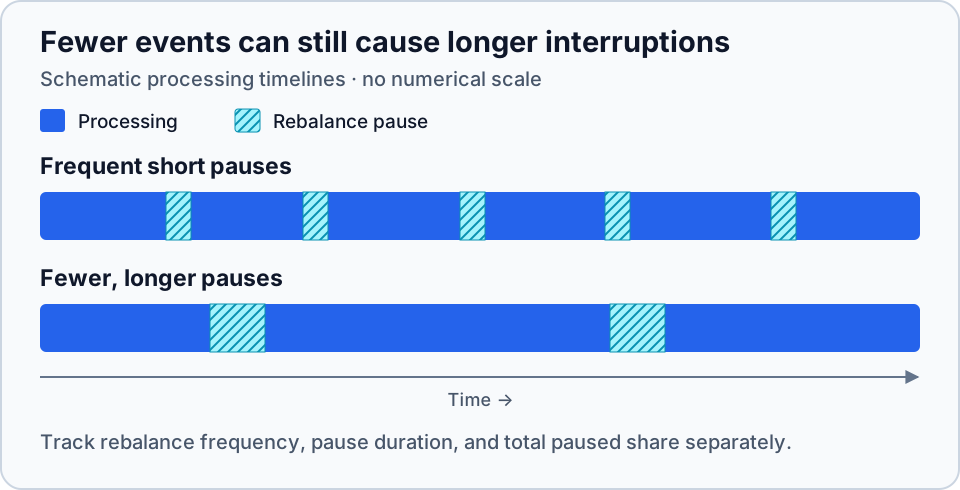
The diagram separates two things I now monitor together: how often processing is interrupted and how long each interruption lasts. It has no numerical scale.
I compared partition-pause duration and lag for every workload, not only the one with long jobs. Because incoming traffic also changed, I could not assign all additional backlog to rebalances. Lower error counts alone would have missed that finding.
I investigated the remaining disconnects separately
The investigation found JoinGroup requests failing after waits close to a configured connection timer. I treated that timing as a lead: was a connection being closed while group coordination was still in progress?
The report identified the request and its cancellation timing. To establish the cause, I would correlate them with coordinator rediscovery and connection events around the failure. Broker logs and network evidence were still needed to establish which component closed the connection.
connections.max.idle.ms controls idle connections; max.poll.interval.ms controls polling progress. They are not interchangeable timers. A consumer can process for a long time while background heartbeats keep its coordinator connection active. Increasing an idle timeout may help a demonstrated connection-lifecycle problem, but it does not make a busy listener return to poll sooner. Kafka consumer settings.
Longer polling intervals and adjusted connection-idle limits remained possible staging experiments. I had not established them as a final fix. Even if slow processing stops triggering timeouts, deployments, failures, and membership changes can still trigger rebalances.
I checked redelivery and acknowledgement behavior too
A failed commit can mean the application finished work but could not save its progress after losing valid group membership. Recovery starts from the committed position for each partition, so completed work beyond that point can be received again. It does not mean every record in the returned batch must repeat. Kafka offsets and recovery.
I also found an important difference in the listener's error paths. Catching a processing error, leaving a record unacknowledged, and returning normally did not guarantee replay. A later successful acknowledgement in the same partition could advance the committed offset past that record. I needed to check the error handler, seek/retry behavior, and acknowledgement mode together.
For future investigations, I keep a repeated-receive query using structured application fields:
fields @timestamp, jobId, eventType
| filter eventType = "received" and ispresent(jobId)
| stats count(*) as receives,
        min(@timestamp) as firstSeen,
        max(@timestamp) as lastSeen by jobId
| filter receives > 1
| sort receives desc
This version assumes JSON logs expose jobId and eventType; plain-text logs need a parse expression for their format. Repeated receives are not proof of repeated successful side effects or simultaneous execution. I check completion records and idempotency separately.
The measurement I still needed was a real poll batch
I could find long imports in the logs, but the logs did not mark which records belonged to one poll. Adding the durations of consecutive imports would only estimate a processing stretch. It would not prove the elapsed time of an actual returned batch.
For a logger that emits [thread] ... processing took 123ms, this is the diagnostic query pattern I would adapt to find slow work:
fields @timestamp, @message, @logStream
| filter @message like /processing took/
| parse @message /\[(?<thread>[^\]]+)\].*processing took (?<durationMs>\d+)ms/
| filter ispresent(durationMs)
| fields @timestamp, thread, durationMs / 1000 as durationSeconds, @logStream
| sort durationSeconds desc
| limit 100
The text and duration in that log shape are examples, not a required application format. I would inspect the identified thread and log stream around the relevant timeout. CloudWatch parsing supports extracting those fields.
To choose a timeout from evidence, I would add consumer identity, poll/batch identity, record count, batch start and completion, and the full interval before the next poll. I would then compare the longest and tail intervals with the configured budget, including downstream work and commits.
The direction I chose: separate groups and improve job processing
The staging results supported the smaller-batch mitigation, while leaving two questions open: why some jobs still exceeded the polling budget and why the remaining JoinGroup requests disconnected.
My final direction was an application redesign with two changes:
- One consumer group per independent workload or processing pipeline. Each group would subscribe to the topics that belong to that workload. Replicas of the same workload would keep the same group ID and share its partitions. This would separate rebalance coordination, so a slow workload's membership changes would not require unrelated workloads to rebalance with it. Broker and downstream resources could still be shared.
- Improve how long jobs are processed. I would measure the full interval between polls, profile expensive processing and downstream calls, and break long jobs into bounded steps where the job allows it. If work moves off the polling thread, the design needs bounded concurrency, backpressure, partition-aware pausing, and preserved ordering. Offsets must advance only through completed work, with explicit retry and idempotency behavior. Kafka processing models describes the polling and worker constraints.
Separate groups address the interruption spreading between workloads; processing improvements address the time spent away from polling. The next implementation steps would include deliberate offset migration for the new group IDs, followed by staging tests of one change at a time using the same monitoring view. I would check restart and rebalance recovery, failed-job retries, repeated side effects, and lag as well as throughput.
Before a production rollout, I would establish its own baseline and compare equivalent before-and-after windows. I would also test recovery during a restart or deployment, not only steady-state throughput. The staging outcome was evidence for the next decision, not a promise about production.
My checklist for the next time this happens
- Start with a chronological log episode and identify the consumer and group.
- Check the effective polling configuration, subscriptions, assignor, and acknowledgement mode.
- Look for poll-timeout-driven departures; investigate disconnects as their own signal.
- Measure useful throughput, lag, rebalance frequency and duration, commit failures, and repeated receives together.
- Check CPU, memory, restarts, and slow database or downstream calls.
- Compare complete windows with similar input volume and job mix.
- Measure actual poll boundaries before selecting a larger timeout.
- Verify both processing progress and recovery before extending a staging change to production.
References I would return to
The versioned Kafka references below use 4.3. For a running application, I select the matching library and broker documentation when checking metric availability, settings, and protocol behavior.
- Kafka 4.3 consumer API: group membership, offsets, and processing models.
- Kafka KIP-62: polling, background heartbeats, and classic rebalances.
- Kafka 4.3 configuration and monitoring: settings and metrics.
- Spring Kafka listener containers: concurrency and acknowledgement modes.
- MSK consumer lag: lag metrics and missing-data conditions.
- CloudWatch queries: filtering, parsing, aggregation, and visualization.